![SmartTRAK.png]](https://help.smarttrak.com/hs-fs/hubfs/SmartTRAK%202.0%20Logo%20Art/SmartTRAK.png?height=50&name=SmartTRAK.png)
Quickly assess your product profile and find how to fill the gaps with SmartTRAK's Gap Analysis tool. Need a quick primer on how to use this tool to your advantage? See our introduction video below or scroll down for a text version.
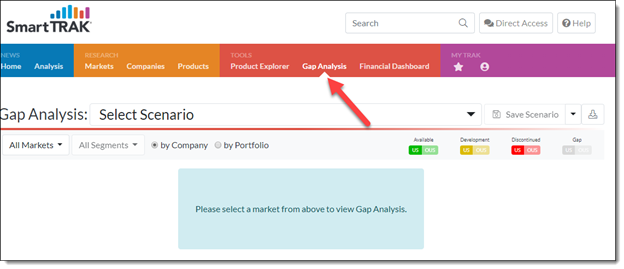
If your SmartTRAK subscription includes Gap Analysis, you can access it right from the top navigation bar. Gap Analysis allows you to quickly take a holistic view of your product profile and allows you to analyze the gaps that exist and quickly find competitor products that could help you fill those gaps.
 If
If
Let’s say we work at Depuy Synthes and are interested in rounding out our knee replacement portfolio with a patellofemoral implant. To review the product landscape, select Total Joints and then Knee Replacement.
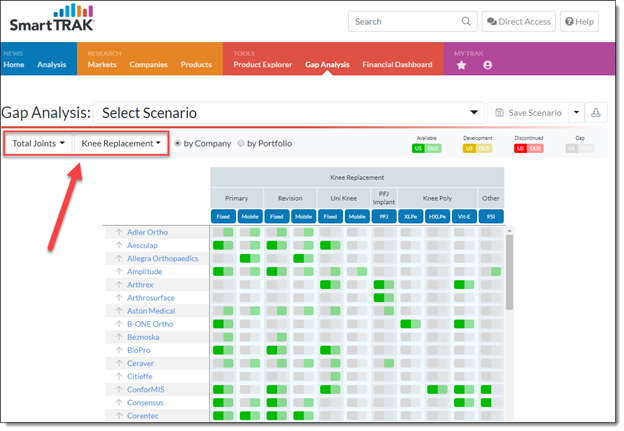
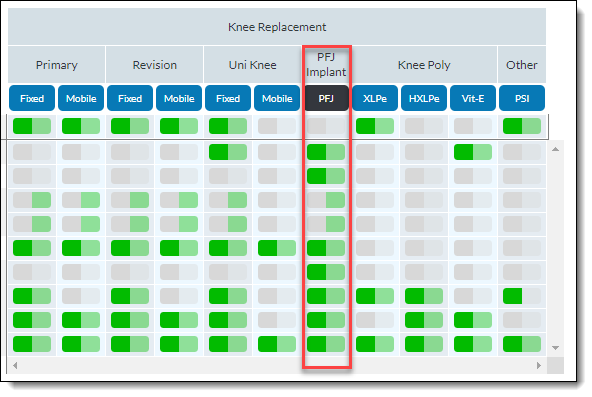
A chart would be generated with a list of all the companies that offer knee replacement technologies.
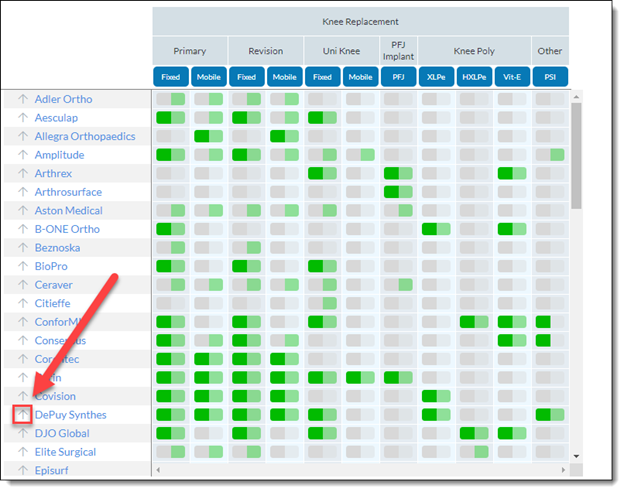
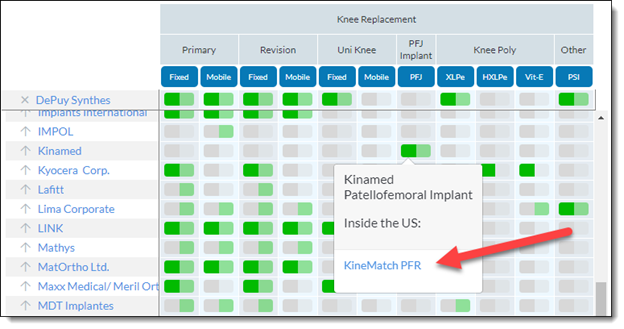
Since we are focusing on Depuy Synthes, we would locate them in the list and anchor them to the top by clicking the arrow next to their name.
Now we can easily compare our portfolio offering to others.
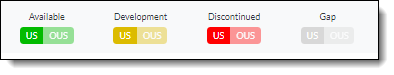
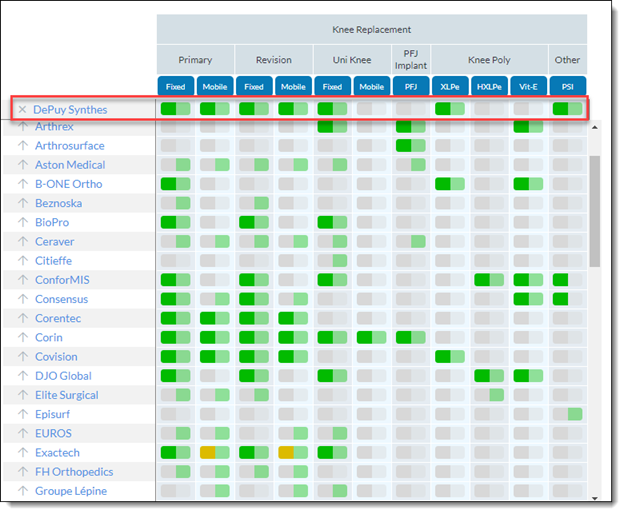
Our easy to read chart is sorted by treatments and technologies. The small pills and their colors tell which products are currently available, in development, discontinued and where there’s a gap. The left side of the pill denotes the status for the US and the right side for Out of US or OUS.
As we look across Depuy Synthes’ portfolio we can see the gap in their knee portfolio for a PFJ Implant. To see what companies have products that can fill this gap, simply click the PFJ blue box. This instantly filters the knee replacement market, showing you the 9 companies that currently have a PFJ Implant on the market or under development in both the US and EU.
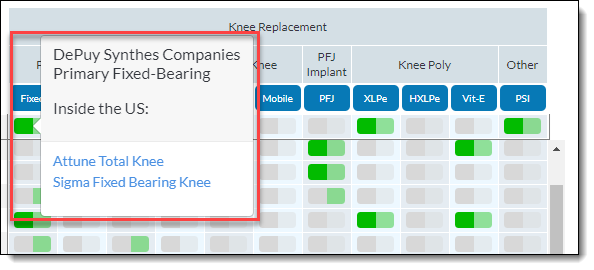
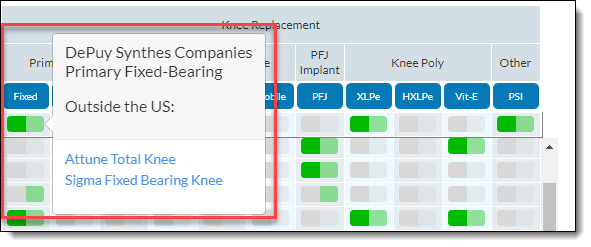
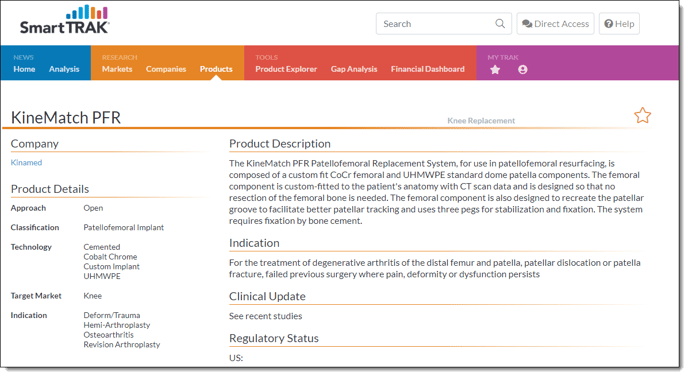
Let’s say we were interested in learning more about the product offered by Kinamed. Simply click the green pill to see what product is on the market in the US (click left side of pill) and OUS (click right side of pill). Here we can see that their KineMatch PFR is available in both places. To learn more about the product we can click through to their product profile. (Click KineMatch PFR).
(Go back to Gap Analysis scenario)
Or to learn more about the company, click the company name on the left which will bring you to Kinemed’s Company Profile.
As you work with Gap Analysis, here are some helpful features we would like to point out.
If need more clarification on the product’s classification, simply hover over the blue text to see an explanation of the product category.
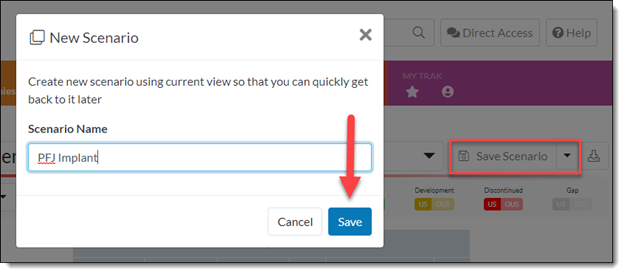
To save your search, choose Save Scenario. You can access this chart at a later date by selecting it from the “Select Scenario” drop down.
Lastly, as with all our charts and graphs, you can download your scenario to your desktop for use in reports or presentations.