![SmartTRAK.png]](https://help.smarttrak.com/hs-fs/hubfs/SmartTRAK%202.0%20Logo%20Art/SmartTRAK.png?height=50&name=SmartTRAK.png)
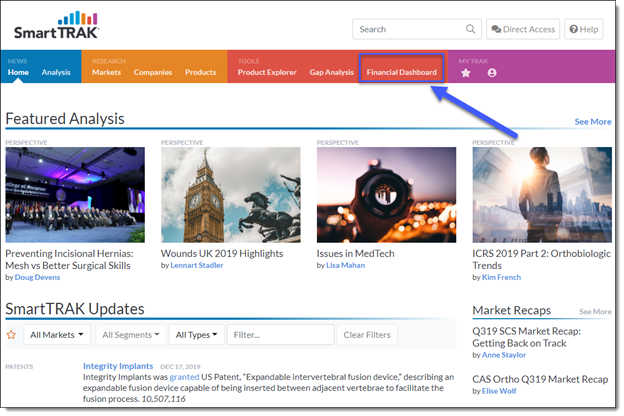
Are you tasked with doing your due diligence for a market opportunity? Or maybe you want to see how you stack up against your competitors? Financial Dashboard makes it easy to evaluate the market in seconds. Our quick video tutorial below will make sure you're getting the most out of this valuable tool.
Prefer to have steps outlined for you? See our below step by step tutorial to getting the most out of Financial Dashboard:
Financial Dashboard provides a quick and easy way to size up a market as well as determine revenues and competitive shares. Subscribers use this tool on a quarterly or annual basis to quantify a market segment, gauge market share, and compare year over year growth, and even for forecasting.
Users are able to sort data by market, segment, sub-segment, and region of the world. They are also able to select different time-frames to be able to compare growth and spot trends.
Let’s say we work in Wound Care and are thinking of expanding our portfolio to include a Biologics product. Financial Dashboard would enable us to quickly and efficiently evaluate the market opportunity.
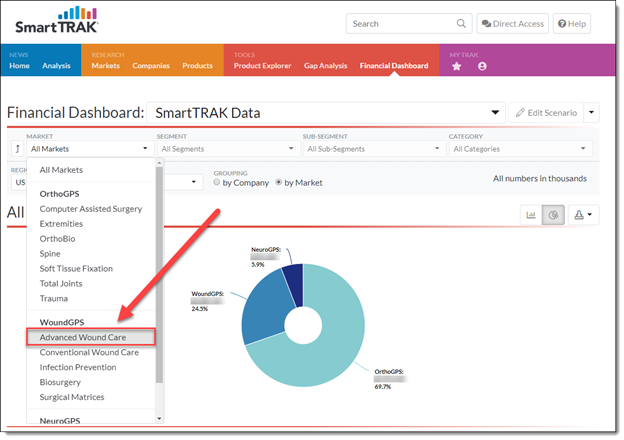
Since Biologics are covered in our Advanced Wound Care segment, we would first select Advanced Wound Care in the market drop-down. (Select Advanced Wound Care from the Markets drop-down)
Here we would see a top-level view of the Advanced Wound Care market with Biologics making up a substantial piece of the pie.
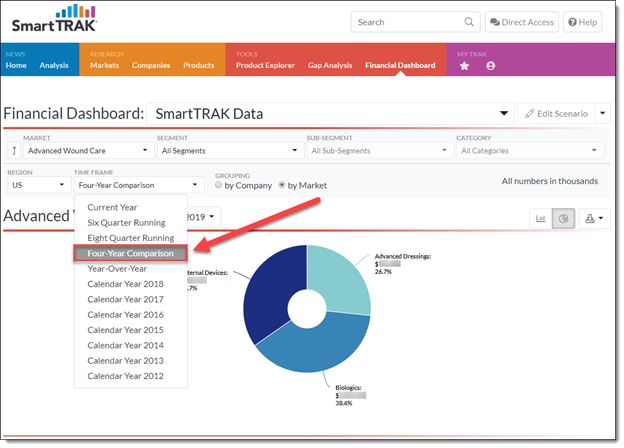
To see revenue trends in the Biologics space, we can adjust our time frame to four-year-comparison. Here we can see the market’s been growing at a steady pace year over year.
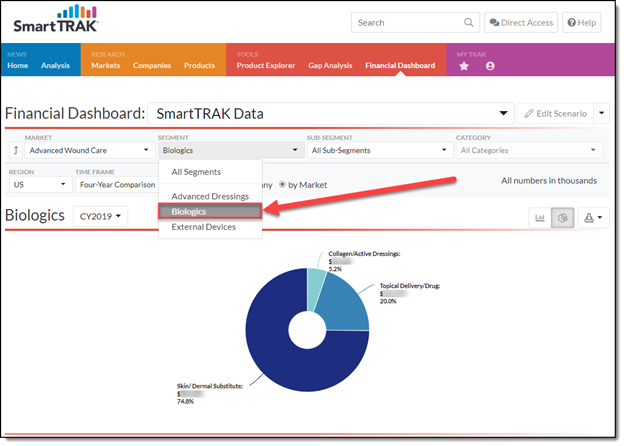
To drill down further on Biologics and understand what’s driving the growth and who the major players are in the market, we can select Biologics in the Segment Drop Down. Now we can see that Skin/Dermal Substitutes make up the largest percentage of the Biologics Market. We can also see that this segment has been growing at a double-digit pace over the last few years.
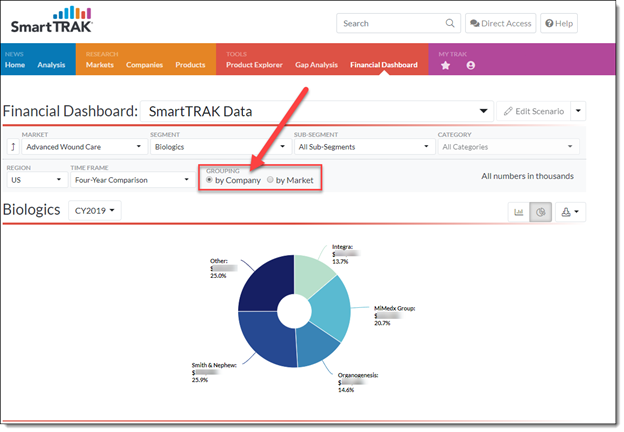
To see what this looks like from a competitive market share perspective, we simply would change the view from market to company. We can now see that MiMedx is the pack leader.
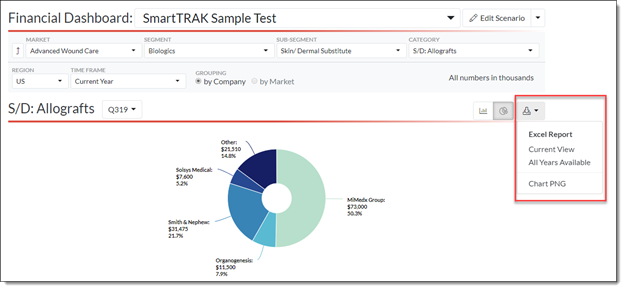
To download any charts or graphs from Financial Dashboard for use in reports or presentations, simply click the print icon at the top of the graph.
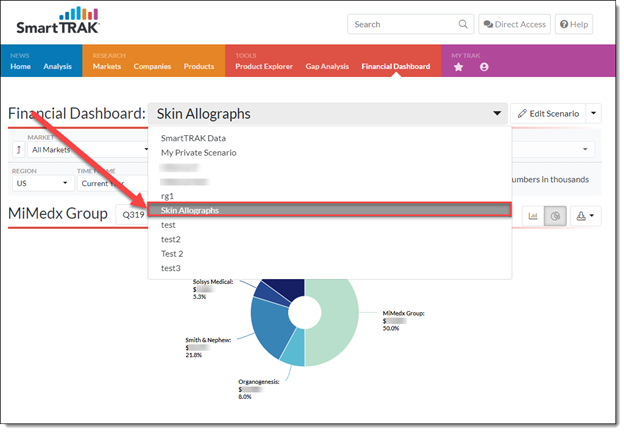
Great for forecasting, Financial Dashboard also allows users to create their own financial scenarios and save the data all within the tool. Let’s say we worked at MiMedx and wanted to project out our fiscal year to date revenues against the competition for Skin Allografts. (Choose, Market: Wound Care, Segment: Biologics, Sub-Segment: Skin/Dermal, Category: S/D: Allografts, Time Frame: Current Year)
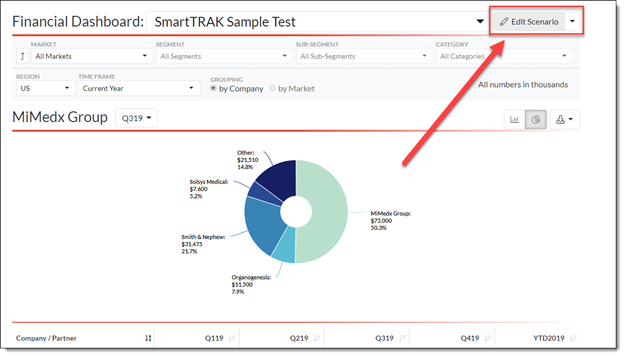
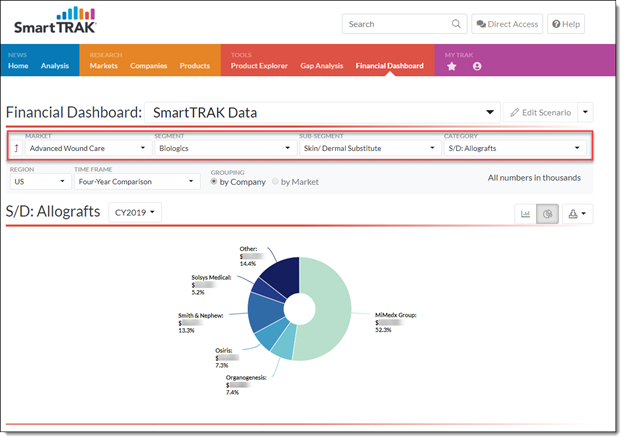
To do this, we would drill down as far as we could into the data selecting Advanced Wound Care, Biologics, Skin/Dermal Substitute under sub-segment and Allografts under category. We would also change our timing to current year and then hit Edit Scenario.

We would then be able to click on and edit any box within the chart as well as input our own growth projections for ourselves and competitors. Edited numbers will appear in green in the chart to distinguish them from SmartTRAK numbers. To revisit this scenario throughout the year, we would simply hit save scenario. We could easily access this scenario again from the drop down at the top of Financial Dashboard. All information entered is private and visible only to you.